
EBA Statistical Report 2017
The structure of the 2017 EBA statistical report has been extensively remodelled: this new edition provides more than 120 pages of in-depth information and data about European biogas, biomethane and syngas produced by anaerobic digestion and biomass gasification.It also offers a unique and comprehensive overview of renewable gas production in Europe (data available for 32 European countries), with 23 individual country analyses including the evolution of national support schemes and tracking of National Renewable Energy Action Plan (NREAP) targets. The full Country Profile France from the EBA Statistical Report 2017 is included in the following pages as an example.
The report is available for purchase at €400 for non-EBA members, and is free for EBA members.
[su_button url=”https://www.europeanbiogas.eu/about-us/contact/” target=”blank” background=”#5A801E” size=”9″ wide=”no” center=”yes”]Contact address to order the report[/su_button]
Biogas Plants
The number of biogas plants in Europe has greatly increased. Between 2009 (earliest EBA data) and 2016, the total number of biogas plants rose from 6,227 to 17,662 installations (+11,435 units, see figure below). Growth was particularly strong from 2010 to 2012, reaching double figures every year. Most of that growth derives from the increase in plants running on agricultural substrates: these went from 4,797 units in 2009 to 12,496 installations in 2016 (+7,699 units, 67% of the total increase). Agricultural plants are then followed by biogas plants running on sewage sludge (2,838 plants), landfill waste (1,604 units) and various other types of waste (688 plants).
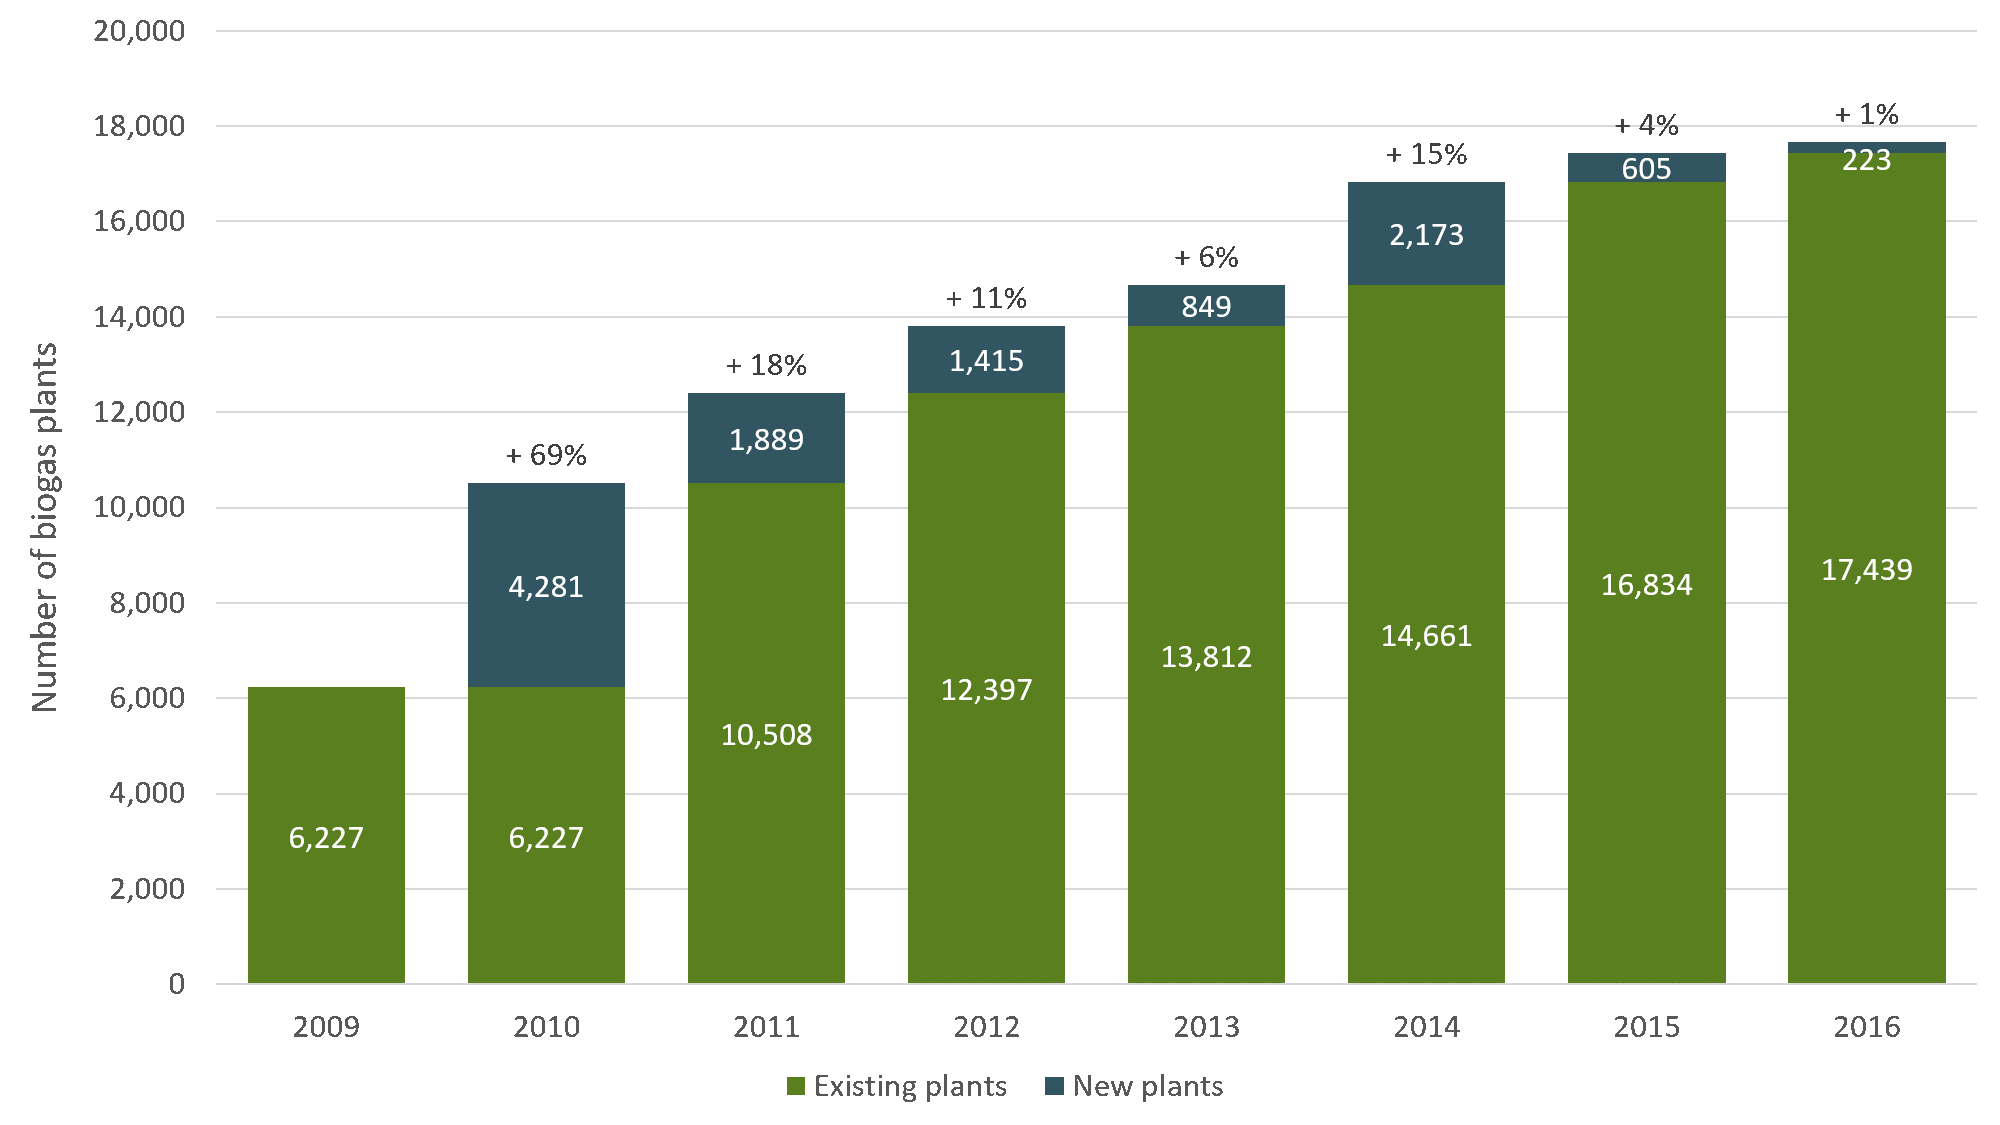
Figure 1: Evolution of the number of biogas plants in Europe
Installed Electric Capacity (IEC) in the Biogas Sector
Although the number of biogas plants in Europe has been stabilising since 2015, the total Installed Electric Capacity (IEC) is on the rise. The IEC increased in Europe from 4,158 MW in 2010 to 9,985 MW in 2016 (+5,827 MW, see figure below). In 2016 alone, the IEC increased by 858 MW (+9%). Growth in Installed Electric Capacity (IEC) since 2011 has been mainly due to the building of plants running on agricultural substrates: such plants went from 3,408 MW in 2011 to 6,348 MW in 2016 (+2,940 MW – 56.5% of the total increase).
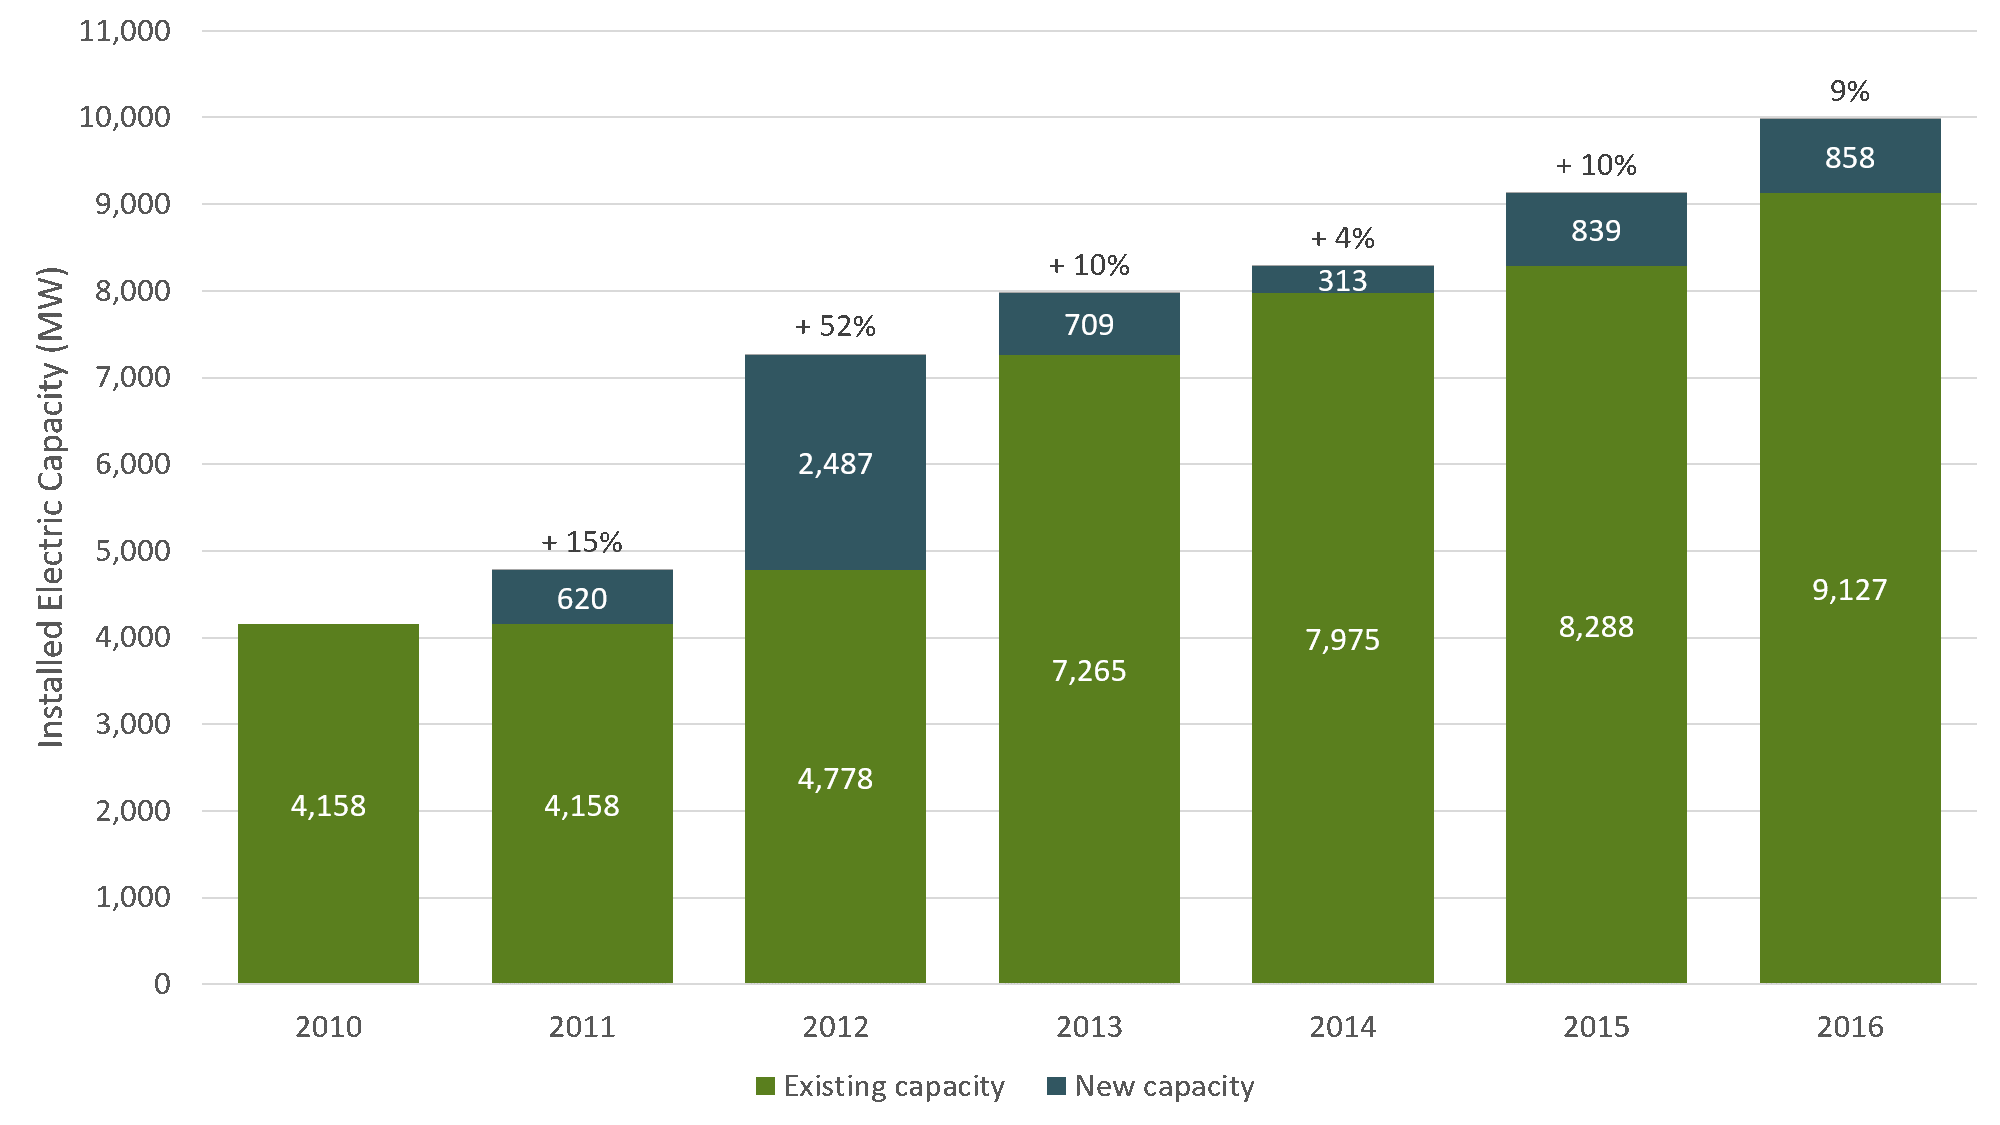
Figure 2: Growth in Installed Electric Capacity in Europe 2010-2016 (MW)
Biomethane Production
In line with the development of biomethane plants, biomethane production has greatly increased since 2011: production rose from 752 GWh in 2011 to 17,264 GWh in 2016 (+16,512 GWh, see figure 12-EU). In 2016 alone, biomethane production in Europe increased by 4,971 GWh (+40%): current growth in the sector is therefore demonstrably rapid. The countries which saw the most significant development in biomethane production in 2016 were Germany (+900 GWh), France (+133 GWh) and Sweden (+78 GWh).

Figure 3: Evolution of biomethane production in Europe (GWh)
The report is available for purchase at €400 for non-EBA members, and is free for EBA members.
Please contact info@8s7jivtvq.preview.infomaniak.website delivery details if you would like to order a copy of the full report.


